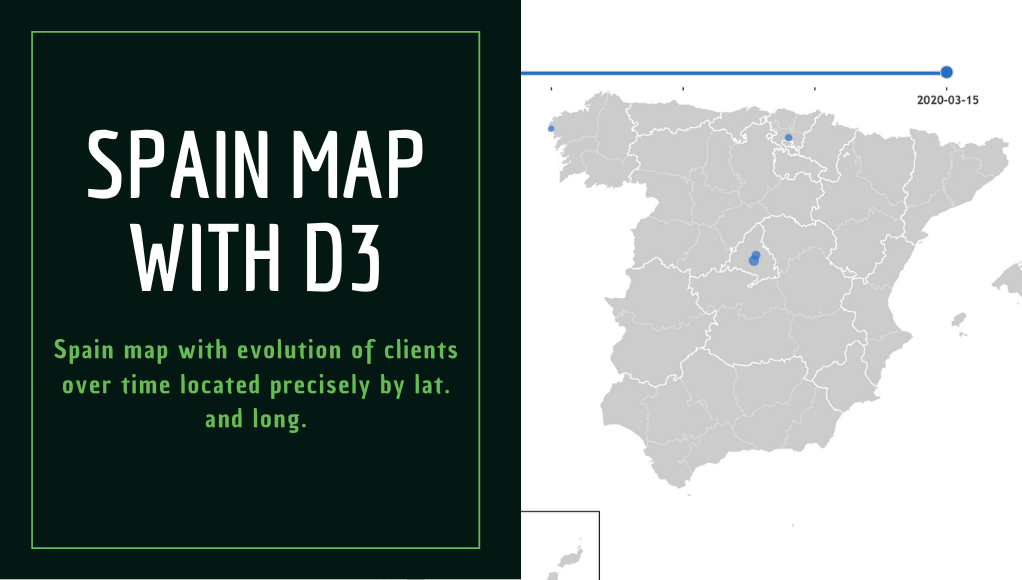
Spain map with D3
Table of Contents
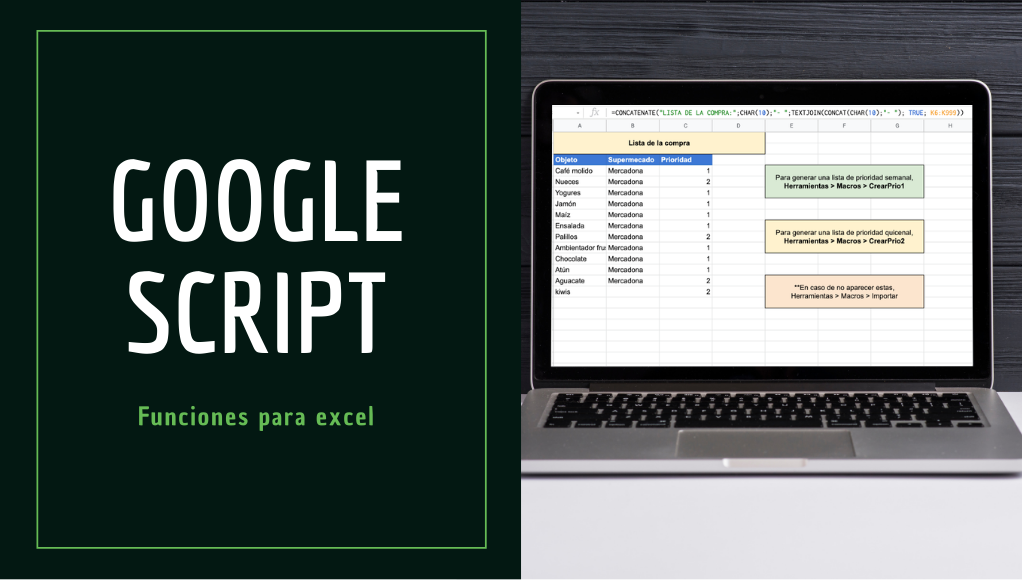
🚀 Environment setup
Since we will manage files and dependencies we choose Flask for a quick example. Any other framework could be used, it only consist on importing correctly all libraries.
The libraries used are the following:
Jquery: Common library used almost for anything. (Desc)
Jquery UI: Visual extension for Jquery (Desc, in this case used to create the time slider. We also add another extension (Ui slider pips) to this slider to customize even more.
D3: D3.js is a JavaScript library for manipulating documents based on data. D3 helps you bring data to life using HTML, SVG, and CSS. In this case we use to create a map of Spain. More examples of D3 here.
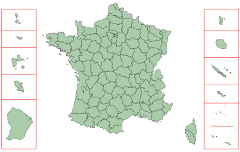
D3 composite: Extension of D3 that allow to create proyections of maps. For example, in the case of Spain since the canary islands are far away from the peninsula, only using D3 we have a really off center map. This library also provides Spain provinces limits . Important: This library only works with the current set of Jquery and D3 version, if you want to use other versions, check the docs page.
Using this D3 composite we could do something like that:
Other: Here are some other resources we have used to create:
- Spain map Base map of Spain
- Walmart’s Growth Base Slider Example
- Hexbin Map Base map of concentration points
- Nominatin Web used to get Lat. and Long. from a city name. Example:
https://nominatim.openstreetmap.org/search?format=jsonl&q=Madrid
To run the this project you only need to install Flask and run inside the project:
flask run
🤔 Project explanation
Explained Step by Step this map creation:
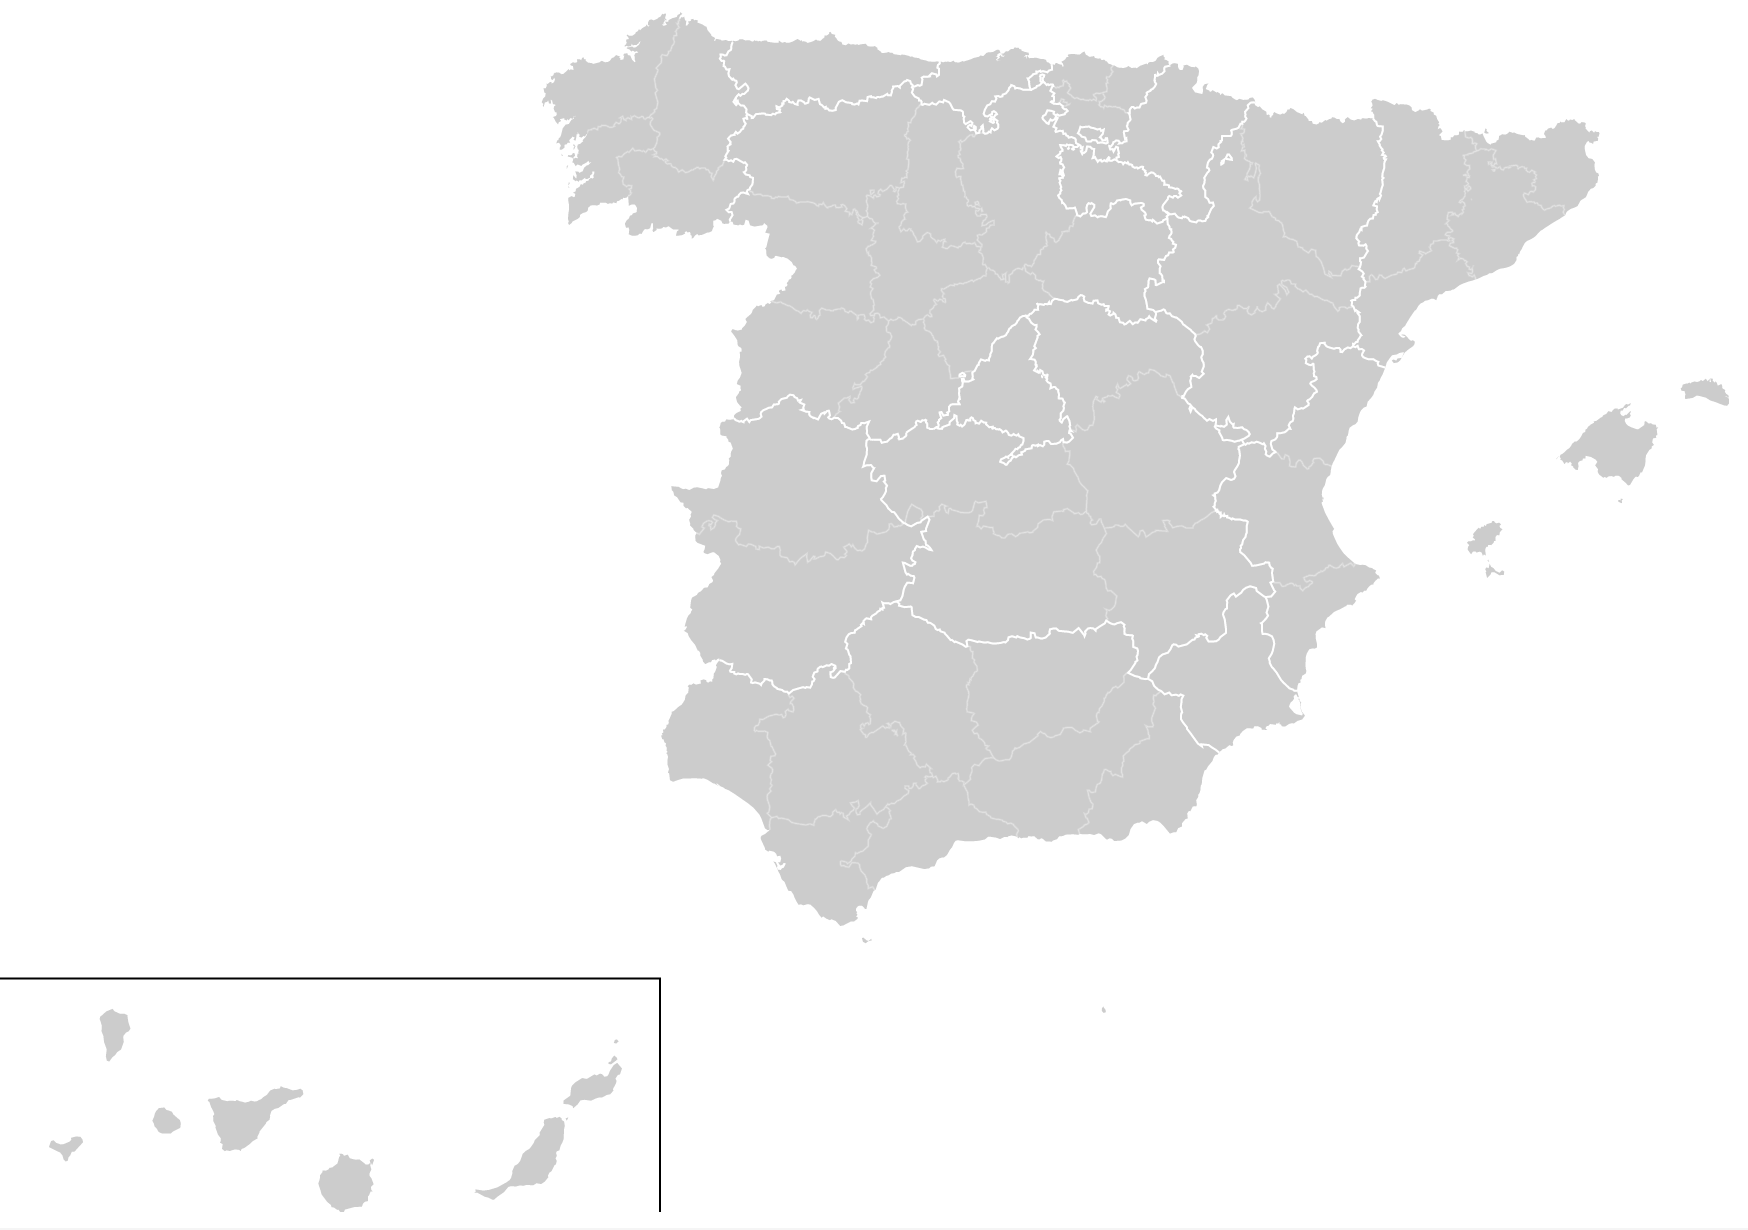
Creating Spain Map
First of all we will create a D3 SVG map. For that we need some things:
- Get all Spain province Limits from https://unpkg.com/es-atlas@0.2.0/es/municipalities.json”
- Create an
<svg></svg>object in html to find that. - Use from D3 composite
geoConicConformalSpain()for Spain Map
For that we just need to:
    const svg = d3.select("svg");
    const projection = d3.geoConicConformalSpain().fitSize([900, 500], topojson.feature(es, es.objects.provinces));
    const path = d3.geoPath(projection);
Then we need to create provinces limits of Spain.
    svg.append("g")
        .selectAll("path")
        .data(topojson.feature(es, es.objects.provinces).features)
        .join("path")
        .attr("fill", '#ccc')
        .attr("d", path);


    svg.append("path")
        .datum(topojson.mesh(es, es.objects.autonomous_regions, (a, b) => a !== b))
        .attr("fill", "none")
        .attr("stroke", "white")
        .attr("d", path);
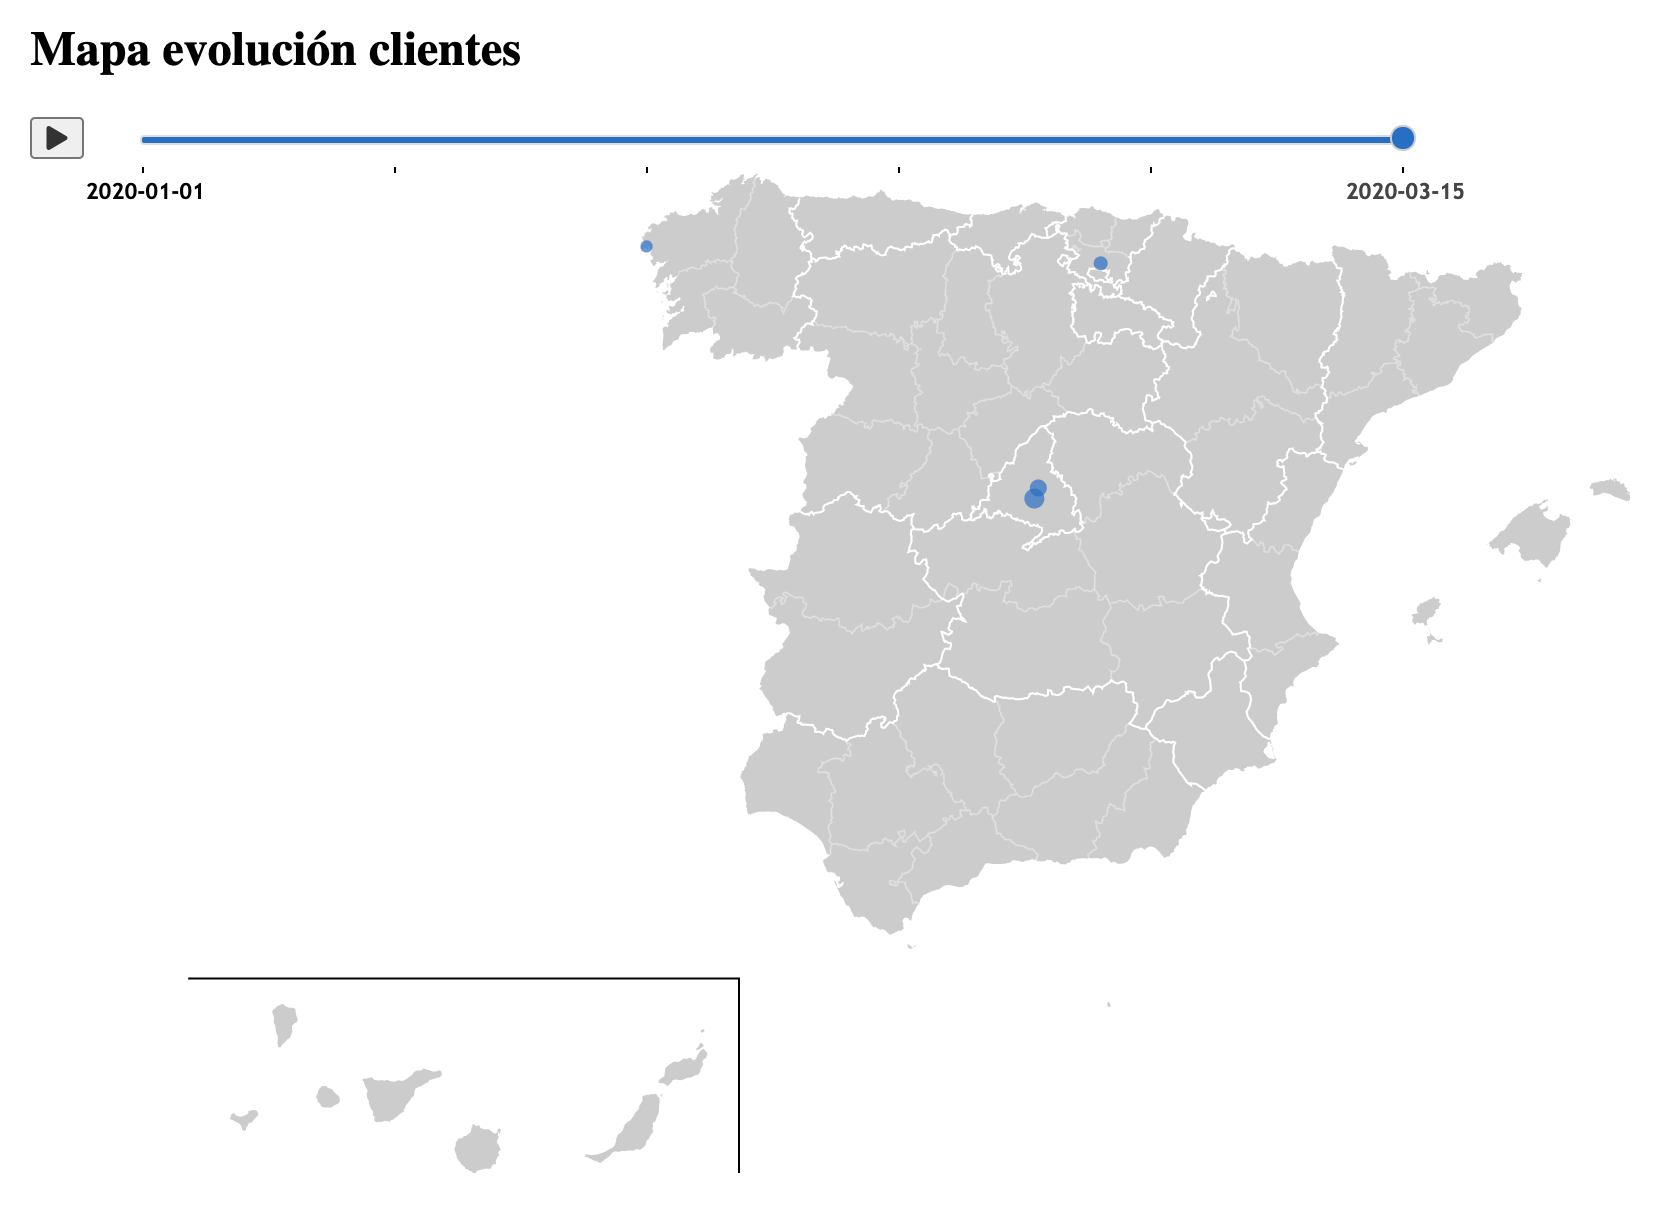
Adding clients points
Now we need to add the clients evolution. For that we have created files located in the /data folder containing that day distribution of clients. This contains: An example:
- Name for tooltip
- Lat. and Long. for localization
- Count of clients, to show the tooltip and also the size of point.
[{"name": "Alcobendas", "long": -3.64554, "lat": 40.52456, "count": 2},
  {"name": "Madrid", "long": -3.7035825, "lat": 40.4167047, "count": 3}]
Having that, we will find all files and get names and contents to pass to JS.
  files = {}
  for file_name in [f for f in sorted(listdir(base_name))]:
       file = open(base_name+'/'+file_name,mode='r')
       files[file_name.replace('.json','')[3:]] = file.read()
       file.close()
After that, we create a function to show points (To reuse in the slider later) and show the initial points. Mouseover function show the tooltip with name and counter.
    const updateStats = (name) => {
        svg.selectAll('circle').remove();
        svg.selectAll("circle")
            .data(name)
            .enter()
            .append("circle")
            .attr("class", "affected-marker")
            .attr("r", d => calculateRadiusBasedOnAffectedCases(d.count))
            .attr("cx", d => projection([d.long, d.lat])[0])
            .attr("cy", d => projection([d.long, d.lat])[1])
            .on("mouseover", this.mouseover)
            .on("mouseout", this.mouseleave);
    };

    updateStats(JSON.parse(address_data.files_contents[0]), projection)
Adding time slider
Ok, we have the map created and initial points set. Now it’s time to create the time slider with all dates, on updating will also update the points.
 $(".slider").slider({
        range: "min",
        min: 0,
        max: address_data.files.length - 1,
        animate: "fast",

        change: function (event, ui) {
            updateStats(JSON.parse(address_data.files_contents[ui.value]), projection);
        },
        slide: function (event, ui) {
            updateStats(JSON.parse(address_data.files_contents[ui.value]), projection);
        }
    }).slider("pips", {
        first: "label",
        last: "label",
        labels: address_data.files,
    }).slider("float", {
        labels: address_data.files,
    });
As final point, we just need to create a play/pause icon to see dinamically the evolution. This is done using the SetInterval function of Jquery
 run_btn.on("click", function() {
        if ($(this).data("value") === 1) {
            sliderVal = $(".slider").slider("value");
            sliderInterval = setInterval(function () {
                sliderVal += 1;
                if (sliderVal >= (address_data.files.length)) {
                    clearInterval(sliderInterval);
                    run_btn.html('<i class="fa fa-play"></i>');
                    run_btn.data("value", 1);
                } else {
                    $(".slider").slider("value", sliderVal);
                }
            }, animationDelay);
            $(this).html('<i class="fa fa-pause"></i>');
            $(this).data("value", 0);
        } else {
            clearInterval(sliderInterval);
            $(this).html('<i class="fa fa-play"></i>');
            $(this).data("value", 1);
        }
    });
🤔 Result


Comentar